By Eric Mersch
As CFO strategists, we are often asked “how fast should I grow?” This is a complex question requiring detailed review of the company’s product market fit and go-to-market strategy. We use a mix of unit economics and higher-level revenue growth and profitability margins to answer this question when it comes to SaaS enterprises. In this article, I focus on the higher-level SaaS metrics.
“Rule of Forty”
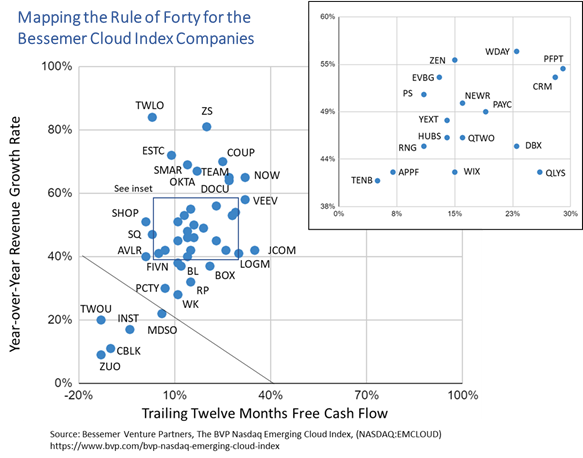
The “Rule of Forty” is a SaaS industry guideline used to evaluate “good growth.” The metric postulates that the sum of a company’s annual revenue growth rate and free cash flow margin should exceed 40%.
![]()
The Rule of Forty acts as a common denominator that allows SaaS companies with a wide variety of go-to-market strategies to benchmark their growth. Some SaaS companies, particularly Series B to C companies, seek to maximize growth to achieve breakout and dominate their space. Such companies spend heavily to realize the growth required to accomplish these objectives. More mature SaaS companies solidify their market positioning and typically seek to reduce their burn rates through pricing power and increased reliance on efficient upsells and cross sells strategies.
The Rule of Forty also drives your financing strategy. SaaS companies pursuing category-creation strategies may need higher levels of sales and marketing expense in the short term in order to achieve growth much later. Those seeking to build complex products may require above average R&D expense to bring their products to market. Enterprise SaaS companies fall into this category due to long sales cycles and extensive implementation processes. Such companies will perform lower on the Rule of Forty metric.
The following chart shows the distribution of the companies in Bessemer Venture Partners’ BVP Nasdaq Emerging Cloud Index (NASDAQ: EMCLOUD) as mapped per the Rule of Forty.
As with any metric, the Rule of Forty should be used as a guideline and not as a hard and fast rule. However, as a CFO you need to make sure that you have a good response when asked why your company lags in this metric.
T2D3 Rule of Thumb
T2D3 is a finance rule of thumb that defines best-in-class revenue growth. I first read about the T2D3 Rule of Thumb in a February 1, 2015 TechCrunch post[1] by Neeraj Argawal, a General Partner at Battery Ventures, but do not know the original attribution.
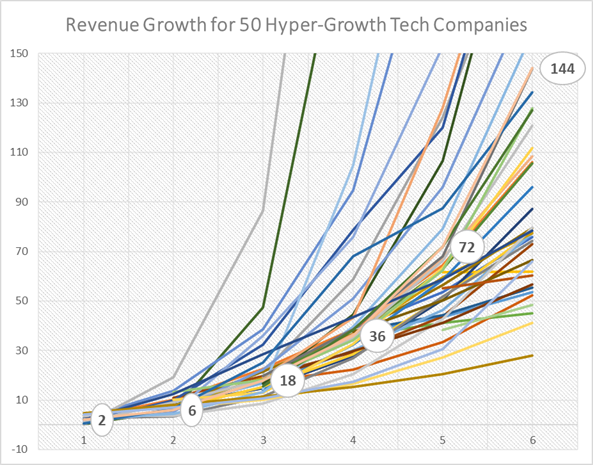
This rule postulates that for revenue in single-digit millions, revenue growth should triple for the first two years, then double for the subsequent three years. For example, a company that reaches $2M in revenue in year 0, revenue should grow to $6m in year 1, $18m in year 2, $36m in year 3, $72m in year 4 and $144m in year 5. This benchmark is based upon growth trajectories achieved by 50 hyper-growth technology companies, as shown in the following chart.
As a rule of thumb, this is a principle with broad application and, as such, might not necessarily be useful or reliable for your particular company. However, it is valuable in providing your management team with stretch goals and in helping them to understand what is possible. I find it particularly useful during the planning season in helping to frame growth possibilities.
Growth Efficiency or Growth Efficiency Index (GEI)
The Growth Efficiency or Growth Efficiency Index metric is another rule of thumb. In my experience, I find application of this method somewhat useful for private SaaS companies, but only as another parameter to augment your growth analysis. The main use case is in estimating burn rate at any given growth rate. The main shortcoming of GEI is the lack of consensus on the standard, although some experts suggest a figure of 1.0. There are also a variety of other methods to benchmark your company’s burn rate.
The equation is as follows:
![]()
We can use the T2D3 rule to frame an example. Let’s assume that a company grows 3x annually from $6M ARR to $18M ARR resulting in $12M of Net New ARR. The GEI suggests that you can burn $1M per month to achieve this growth.
Note that public SaaS companies produce highly variable GEI metrics that may be less useful. For example, Elastic NV has a GEI of 11, while Dropbox has a GEI of -2.3.
Growth Persistence
The Growth Persistence metric is based upon data that shows an exponential decay of annual growth. This is an older metric often based upon data from mature companies in all industries and used to evaluate comparable companies. Scale Venture Partners has done some good work in this area for SaaS companies and developed this relationship:
![]()
My analysis of the T2D3 data shows a median Growth Persistence of 92%, which is in the same range. I find this metric useful for financial planning processes in companies above $100M in ARR.
Operating Leverage or Degree of Operating Leverage
Operating leverage is a measure of how revenue growth translates into growth in operating income. There are many ways to calculate this KPI, but the main measure is Degree of Operating Leverage, or DOL.
![]()
Like Growth Persistence, this is a metric used for more mature companies above $100M in ARR.
Application of DOL metrics to SaaS companies is often difficult because intense market competition and the rate of innovation required to remain competitive results in widely varying results. For example, Zuora produced DOL metrics of -.41 and -.12 for FY2019 and FY2018 respectfully. These results mean that the company performed worse from FY2018 to FY2019 and that performance degraded from the prior year calculation. Zuora trades at 5.5x revenue. On the other end of the spectrum, Coupa Software trades at 25x, but shows metrics worse than those of Zuora. Coupa showed positive DOL for FY2017, but negative DOL for FY 2018.
For these two SaaS comps, other metrics drive the valuation multiples. Specifically, Coupa Software had 67% gross margin in FY 2019 and this represented an increase over that from the prior year. Zuora had a FY2018 gross margin of 50%, which decreased from prior year.
These examples illustrate the value of DOL, in that comparisons between revenue and contribution margin, or the profit from revenue after variable expenses, should be positive. Coupa’s growing gross margin is proof of this. You can also use this metric adding in variable items such as sales and marketing spend.
Summary
The practice of using unit economics to evaluate SaaS business performance is well documented. Here, I provide a different approach for evaluating efficient growth from a revenue and profitability perspective. All of these metrics are valuable in your analysis of SaaS company performance and all should be used in combination with other Saas metrics to provide a complete view of growth prospects for your enterprise.
[1] The SaaS Adventure, Argawal, Neeraj, 2/1/2015 https://techcrunch.com/2015/02/01/the-saas-travel-adventure/

Eric Mersch
Eric Mersch has over 25 years of executive finance experience including twice serving in public company Chief Financial Officer roles. Eric is an equity partner at FLG Partners where he works as an Interim CFO to venture and private equity portfolio companies, specializing in Strategy and Operations, Strategic Planning, Equity…Read More