By Eric Mersch
FLG Partners has consulted with many SaaS businesses – from startups to enterprise-level. Our deep CFO consulting and board advisory expertise is used to improve operational and financial performance of these SaaS entities leveraging key industry metrics and benchmarks including (but not limited to):
SaaS Financial Metrics
Annual Contract Value (ACV) – The annual value of a customer’s Subscription Revenue only. It does not include non-recurring activities. The SaaS business model relies on Subscription Revenue because it is recurring revenue delivered at a very high gross margin. Providing software as a service generates value for the company over a much longer period than does perpetual software. This is the main value of the SaaS model, therefore, nearly all SaaS metrics use Subscription-related terms. Recurring revenue such as maintenance and customer support should not be included in ACV; these are low margin activities that do not add significant value to the business model.
Total Contract Value (TCV) – The total value of the contract’s Subscription Revenue measured over the life of the contract regardless of the Billings terms. As an example, a 2-year contract has a TCV that is twice the amount of its ACV. Billing terms do not impact the TCV. In this 2-year contract example, Billing terms can require an upfront payment for the first year or an upfront payment for the two years. Regardless, the TCV will be the same in both scenarios. Note that the calculation may change slightly if the contract includes annual price increases. If, in our example, the price for second year of the contract increases by 20%, then the TCV will be 2.2x the ACV. For reporting purposes, a useful metric is the ratio of TCV to ACV. The higher the ratio the “stickier” the customer base, leading to retention improvements and a more efficient sales cycle.
Subscription Bookings – At the highest level, the Subscription Bookings metric is defined as the ACV of a contract’s Subscription Revenue. We use annual values because all Go-To-Market benchmarks are expressed in annual values. Plus, industry professionals, whether they are investors or operators view the company’s metrics on an annual basis. Another reason is that operators manage the business on an annual time period. Budgets are created for a given fiscal year. Sales Incentive Plans (SIP) are based on annual quotas and annual attainment milestones for payments. We report on Subscription Bookings separate from all other revenue streams because this revenue is the most critical to the success of the business.
Recurring Bookings – This is a term for the ACV of all recurring product and services contracts. Subscription Bookings are always recurring although contracts with less than one-year terms should be disclosed. An example of this is a pilot subscription. Recurring services bookings include Maintenance and Support revenue if the company is required to provide such services throughout the contract term. The adoption of ASC 606 creates a unique reporting situation for one-time professional services related to onboarding a new customer, such as implementation and integration, software and business process customization, and training and enablement. Under ASC 606, these services are capitalized and amortized over the expected customer lifetime and this turns Professional Services bookings into recurring revenue. However, this is a GAAP requirement and is not relevant to SaaS reporting. CFOs should still report Professional Services Bookings as Non-Recurring Bookings.
Non-Recurring Bookings – This is the dollar value of all contracts for non-recurring revenue such as professional services or hardware sales.
Total Subscription Bookings – The ACV of both New Subscription Bookings and Renewal Subscription Bookings. We report these two Bookings types separately because Renewal Bookings are generally much less expensive to achieve than are New Subscription Bookings. In my experience, the CAC of Renewal Bookings can be a low as one-fifth that of New Bookings.
New Subscription Bookings – The ACV of both New Customer Subscription Bookings and Expansion Subscription Bookings as measured on the contract signature date, i.e. the Bookings Date.
- New Customer Subscription Bookings – The ACV of new logos acquired by the business measured on the contract signature date as well as “Fast Follow” Bookings, which are Bookings that close in the same month as that of the contract signature date.
- Expansion Subscription Bookings – The ACV of Upsell and Cross-Sell Bookings that close in the month following the month of the original contract signature.
- Upsell Subscription Bookings – The ACV of contracts that increase the customer’s utilization of the original product. Adding more seat licenses or moving a customer to a higher usage tier are examples of Upsell Bookings
- Cross-Sell Subscription Bookings – The ACV of contracts that result in the sale of additional products to an existing customer.
Fast-Follow Subscription Bookings – The ACV of Bookings for an existing customer and that occur in the same month as that of the initial contract. Fast Follow Bookings count as New Bookings for the purpose of sales commission calculations and quota retirement.
Renewal Subscription Bookings – The ACV of contract renewals measured at the Renewal Date, i.e., the date of term renewal regardless of the signature date. For example, a one-year contract with a signature date of 3/15/2022 and a start date of 4/1/2022, will have a renewal date of 3/31/2023. The contract can be renewed at any point before (preferably not after) the renewal date. But as long as the start date for the second year of the contract is 3/31/2023, Renewal Subscription Bookings are deemed to occur on this date. I also picked this example to illustrate a Renewal date that lies in a separate quarter from the start date. In this case, the Renewal Bookings will occur in the first quarter (assuming the company’s fiscal year follows the calendar year). The ACV of the Renewal Subscription Bookings will be the same as that of the original Subscription Bookings. Any increase in ACV for the subsequent year, or years, should be considered Expansion Bookings. This is true even if the original contract includes a price increase.
Reactivation Subscription Bookings – The ACV of Bookings from a prior customer that churned and was subsequently reacquired in a future period. This metric is commonly used in B2C companies that experience high churn due to low switching costs and serve a highly market fragmented market. Such companies run marketing campaigns focused on churned users with specific reactivation incentives based upon the consumers’ behavior as an active customer. Reactivated consumers are tracked as a separate cohort within the company’s revenue steam. This metric is typically expressed as MRR when used for this purpose.
Billings – The dollar value of the New or Renewal Subscription Bookings amount invoiced on the date defined by the contract terms, i.e., the Billings Date. In Enterprise SaaS companies with a high Average Selling Price, the Billing Date typically starts on the first of the month following the month of the Bookings Date but also may be delayed for several months while the customer waits on new budget dollars from a subsequent fiscal year or has tied payment to certain milestones. In B2C SaaS companies the Billings Date is usually the date that the customer provisions the product by registering and entering a credit card number.
Annual Recurring Revenue (ARR) – The Subscription Revenue of a given period expressed as an annual run rate for all contracts with Revenue Recognition Dates prior to the period close date. ARR differs from CARR mainly due to the time it takes to onboard a customer. Additionally, the customer may want the contract to start on some specific future date. Finally, contracts with start dates after the first of the month are prorated for the number of days active in that month.
Contracted Annual Recurring Revenue (CARR) – The subscription revenue of a given period calculated as an annual run rate for all contracts including those that were signed in the same period. CARR differs from ARR for two main reasons. First, CARR includes the ARR of new customers that are not yet live because the customer onboarding process is not yet complete. The time it takes to get the customer live on (Time to Live, or TTL) is a function of the company’s ability to onboarding new customers efficiently but the customer’s preparedness and commitment may drive a delay as well. So, TTL is not entirely within the company’s control. This dynamic makes CARR a more accurate KPI for Subscription Recurring Revenue. Second, using CARR avoids the step function changes in ARR. These changes are driven by the TTL in that revenue cannot be recognized until the customer is live, the date of which is referred to as the Go Live, thus meeting the GAAP/IFRS revenue recognition criteria for delivery. The contract will not generate revenue until the period of the Go Live date and will accumulate in deferred revenue during this time. Then, in the period of the Go Live date, all of the deferred revenue for this contract will be booked and this will increase the monthly subscription revenue for this customer by the number of months of deferred revenue. In the subsequent period, revenue will drop back down to the monthly subscription revenue. As an example, a new customer with a $120,000 ACV contract, which requires a three-month TTL, will have a monthly revenue pattern of zero for the first three months, $40,000 in the fourth month and $10,000 in the fifth month and all subsequent months. This dynamic introduces volatility into the ARR metric. This is why CARR is the preferred metric for enterprise SaaS companies.
Committed Monthly Recurring Revenue (CMRR) – CARR and CMRR seem to be related, but they are distinctly different concepts. CMRR, pronounced “see-mer”, is the MRR that is under a contract term greater than one month. Put another way, all MRR under quarterly or annual contracts is referred to CMMR. Contracts under longer term contracts have longer customer lifetimes and this makes such customers more valuable. CMMR is a common metric for SMM and B2C companies because they typically offer a mix of monthly, quarterly, and annual contracts unlike Enterprise SaaS companies for which annual contracts are standard. CMMR and MRR are reported together, sometimes just with CMMR as a percentage of total MRR, and the difference between the two provide insight into the stability of the consumer base. For example, a company with 80% CMRR to total MRR has a more stable consumer base than one with 20% because fewer customers can churn in any given month
Exposed ACV / Exposed ARR – The Annual Recurring Revenue of all contracts up for renewal in a given period. This ARR is at risk of renewal and therefore is exposed to churning. Another version of this metric is the term(s) Available ACV or Available ARR. Companies with a high mix of Expansion to New Bookings use these terms to describe the upside available by expanding customers at the renewal date.
Revenue Recognition Date – The date on which the company has met all revenue recognition requirements per GAAP/IFRS as determined by the CFO. This is a change driven by the adoption of ASC 606, which created a new revenue recognition criterion by merging the GAAP and IFRS concepts. Under ASC 606, revenue is recognized when the following criteria are met: (1) customer contract exists with (2) identifiable performance obligations; (3) transaction price determined and (4) allocated appropriately; and (5) satisfaction of the performance obligation.
Subscription Revenue Gross Margin – The gross profit margin of the subscription software revenue only. Gross Margin is percentage of revenue remaining after subtracting the direct costs associated with the delivery of the hosted SaaS product in the period the revenues are generated. These direct costs fall into seven categories (for definitions of these, please visit my article on “Calculating Gross Margin for Enterprise SaaS Businesses“:
-
- Hosting and Infrastructure
- Customer Support
- Professional Services
- Cloud Operations / Platform Support
- Capitalized internal-use software and purchased technology
- Third-party Fees
- Overhead allocations
- Hosting and Connectivity – This is the term I use in my chart of accounts for expenses associated with cloud computing and datacenter operations, infrastructure service providers, cybersecurity, and related software. SaaS companies relying solely on third-party cloud provides, such as Amazon Web Services, Azure or the Google cloud Platform (GCP), pay for (1) servers for processing and storage; (2) internet connectivity; and (3) software that provides security, control, and monitoring services. Those SaaS companies that manage their cloud environment internally will also have depreciation and amortization for hardware and software acquired for this environment.
- Customer Support and Customer Success – Customer Support is the technical support function for customers’ questions on system access and functionality. Enterprise SaaS companies often staff service organizations called Customer Success, which focuses on end user engagement with the goal of increasing retention. If this organization interacts directly with customers and end users routinely, then all or some proportion of the costs should be considered direct costs. Of course, all share-based compensation should be included for eligible employees as required by ASC 718.
- Cloud Operations and Platform Support – Often companies will have a staff that manages the platform. These people are typically a mix of employees and third-party providers depending upon the cloud infrastructure. This department is called Platform Operations and will include engineers with experience in internet security. You may also find regulatory experts working on this team, especially for those companies that need to adhere to the European Union General Data Privacy Regulation, or GDPR.
- Third-party fees – Companies that host financial transactions will have third-party fees such as transaction expenses and external data. Some companies use patented software to support their proprietary software. For example, leading public cloud infrastructure providers and ecommerce platforms, such as Heroku and Amazon Web Services, use Twilio’s SendGrid digital communication platform and this expense is considered direct. External data used in the software are direct if needed to provide the software with the full functionality as marketed to the consumer. Salesforce incorporates news feeds into it platform and pays a fee for this.
- Overhead Allocation – This category, also referred to as Facility Allocation, represents the facility-related expenses – rent, utilities, internet connectivity, maintenance, office supplies and even food & beverages – incurred to support the employees who are directly involved in the service delivery. For more on this subject, you can read our article on Subscription Gross Margin.
Cost of Revenue – Cost of Revenue (referred to as Cost of Goods Sold or Cost of Sales, which are used for retail and manufacturing industries) is the category used to aggregate all direct costs associated with the service delivery of the SaaS product.
Deferred Revenue – Deferred Revenue, also called Unearned Revenue, is a balance sheet account that represents the liability associated with the delivery of a SaaS product as required by contract. For an individual contract, Deferred Revenue is equal to all of the revenue expected to be recognized over the period defined by the invoice. Enterprise SaaS companies typically require upfront annual payment for new or renewal contracts. On the date an invoice is issued, the SaaS company records the value of the invoice as Deferred Revenue and books the same amount to Accounts Receivable: debit Accounts Receivable and credit Deferred Revenue. When the customer pays the invoice amount, the company credits Accounts Receivable and debits Cash. Receipt of payment does not affect Deferred Revenue. Assuming that the invoice is for an annual term, the company records revenue in each month the revenue is earned. Therefore, the company will debit Deferred Revenue by 1/12th of the invoice amount and credit Subscription Revenue by the same amount. On the Balance Sheet, Deferred Revenue is divided into Short-Term and Long-Term accounts. Short-Term Deferred Revenue is that which will be recognized within the next twelve months. Long-Term Deferred Revenue is that amount of revenue expected to be recognized after the next twelve months. For example, a $360,000 TCV deal with a three-year term and paid upfront will generate $120,000 in Short-Term Deferred Revenue and $240,000 in Long-Term Deferred Revenue at date of invoicing. Each month the company will credit Short Term Deferred Revenue by $10,000 and debit Subscription Revenue by $10,000. One the one-year anniversary of the invoice date, the company will move the second year of Deferred Revenue into Short Term Deferred Revenue and continue the monthly revenue recognition cadence for Subscription Revenue.
Remaining Performance Obligation (RPO) – A company’s Remaining Performance Obligation represents the total future performance obligations arising from contractual relationships. More specifically, RPO is the sum of the invoiced amount and the future amounts not yet invoiced for a contract with a customer. The former amount resides on the balance sheet as Deferred Revenue and has always been reported as required by GAAP. The latter obligation, also referred to as Backlog, makes up the non-invoiced amount of the Total Contract Value metric. Thus, RPO equals the sum of Deferred Revenue and Backlog. For more on this subject, you can read our article on The Remaining Performance Obligation (RPO) SaaS Metric.
Adoption of Accounting Standards Update No. 2014-09, Accounting Standards Codification (ASC) number 606: “Revenue From Contracts With Customers” was required for public companies with annual periods that began after December 15th, 2017.
One of the early SaaS adopters was Splunk Inc. which implemented ASC 606 on February 1, 2018, provides a good reference for RPO. For the fiscal year ended January 31, 2019, Splunk reported Total Revenues of $1.80B, Deferred Revenue of $0.88B and RPO of $1.26B. For the following fiscal year, Splunk reported Total Revenues of $2.36B, Deferred Revenue of $1.00B and RPO of $1.80B. Year-over-year growth in RPO was 43% and this exceeded the growth in Total Revenues by 12 points. Since RPO serves as a proxy for future revenue, the RPO growth rate provides a leading indicator of growth. In Splunk’s case, the RPO growth indicates that the company will show Total Revenue growth in fiscal year 2021.
Free Cash Flow – The sum of cash flow from operations and the use of cash for investing activities. This is the most appropriate measure of a company’s burn rate because it includes all expenses related to operating the business irrespective of the financing model. Cash flow from financing activities is not relevant because companies’ make different choices on funding strategy, specifically relating to the mix of equity and debt, based upon market conditions that are unrelated to business operations. It is the best way in which to ensure benchmarks apply. Free Cash Flow should be used in the Rule of Forty growth metric.
SaaS Unit Economics Metrics
The term, Unit Economics, refers to the measurement of the revenues and costs associated with an individual customer. It’s the atomic level view of the business. Viewing the company’s performance in this way will allow you to gain an understanding of profitability on a per customer basis and to measure your performance with established benchmarks.
Customer Lifetime Value (CLTV or LTV) – The average Net Present Value of the Company’s customers as defined by the Average Monthly Gross Profit multiplied by Customer Lifetime.
CLTV = ARPA * GM * Customer Lifetime
where, ARPA is the Average Revenue per Account (also referred to as ARPU or Average Revenue per Unit) as defined by the Average ARR of the customer base; GM is the Subscription Revenue Gross Margin and Customer Lifetime is the average tenure of a customer, and is calculated as the inverse of churn rate for mature SaaS companies, but often set at between 3 and 5 years for early stage companies.
New Customers – The number of new customers in each period is simple for Small and Mid-Market customers because the Bookings, Billings and Revenue Recognition date is the same. Enterprise SaaS companies use CARR, which is defined by the customer’s Booking Date, as well as ARR, which is defined as the Go Live date.
Gross Churn Rate – The percentage of ARR that does not renewal at the contract’s renewal date. For an Enterprise SaaS company, we express this metric in dollars and not customer count because the revenue impact is more closely related to change in absolute dollars churn. Hence, we refer to this as Gross Dollar Churn Rate. Small/Mid-Market and B2C SaaS companies use customer count, and we call this simply Gross Churn Rate.
Retention Rate – Retention Rate is expressed either as a dollar-based metric or customer count-based metric. Enterprise and Small/Mid-Market SaaS companies use dollar-based retention because of the large variance in the customer ACV. So, the loss of one customer may or may not have a material impact on ARR. Contraction in one customer contract would impact ARR, but a count-based metric would not account for this change. Finally, these customers tend to be more stable and less likely to churn. Alternatively, B2C SaaS companies use a count-based metric because average ACV among the customer base is more similar and the customers are more likely to churn.
DBNER – This acronym stands for Dollar-Based Net Expansion Rate, which is defined in the paragraph above and is used by Enterprise SaaS companies.
Renewal Rate – The existing ARR or customers that we successfully renew on the renewal date as a percentage of the total up for renewal. This metric is more common to Enterprise SaaS and Small/Mid-Market SaaS companies because a large portion of the customer base is under contract, typically annual, and therefore not eligible to churn until the contract renewal date. B2C SaaS companies rely on month-to-month contracts so the Renewal and Retention Rates will be the same.
Retention Rate vs Renewal Rate – Note the difference between Renewal Rate and Retention Rate. The Renewal Rate will always be lower than the Retention Rate because the denominator of the former is smaller than that of the latter. As an example, consider a company with $250,000 of Exposed ARR in a specific quarter and this makes up 25% of its $1,000,000 ARR base. The company renews 80% or $200,000 of this Exposed AR. The retention rate during this quarter is 95% or $950,000 of its $1,000,000 ARR base. The $950,000 numerator is the sum of the Renewed ARR, $200,000, and the ARR that was not up for renewal, $750,000.
Expansion Rate – The additional recurring revenue generated from existing customers through either Upsells or Cross-sells, expressed as a percentage of existing ARR. Enterprise SaaS companies use this metric because the ACV of new customers can be expanded by capturing a larger share of their technology budgets either by selling to more users at the customers or by selling more products to the customer. Net Churn Rate / Net Expansion Rate – The net result of Gross Churn Rate and the Expansion Rate. Note that Net Churn Rate is shown as a negative number and Net Expansion Rate as a positive number.
Customer Acquisition Cost (CAC) – The Customer Acquisition Cost is the average cost to acquire a new customer and is calculated as the Sales & Marketing expense in a given period divided by New Customers acquired in the same period.

CAC Payback Period – The CAC Payback Period is the number of months required to pay back the associated customer acquisition costs and is calculated as the CAC divided by the Average Monthly Gross Profit.

Customer Acquisition Cost (CAC) Ratios – The most common CAC Ratio is defined as the Sales and Marketing Expense divided by the New Subscription Bookings. The Bookings number should be matched with the associated Sales and Marketing expense to the extent it is a practical exercise. Typically, Enterprise SaaS companies use figures from the same year since variations in the Sales Cycles makes attribution difficult and, usually, not very valuable. Small and Mid-Market SaaS Companies typically use the prior quarter or month since the sales cycle is shorter for these businesses. Business-to-Consumer (B2C) SaaS companies typically use the prior month’s Sales and Marketing expense because the Go-To-Market strategy focuses on Call-to-Action marketing, which leads to a quick customer response. The CAC Ratio can be interpreted as the Sales and Marketing investment needed to acquire $1.00 of new Subscription Bookings.
Best practice for SaaS companies is to segment the CAC Ratio into two different ratios according to the type sales activity defined as New Customer and Expansion. In my experience, the CAC for Expansion Bookings is approximately one-third the cost of acquiring New Customers. Therefore, distinguishing the CAC for each type of sale aids Go-To-Marketing strategy and management. When you use these specific measures, also provide a Blended CAC Ratio, which is the aggregate calculation for the business.
Customer Lifetime Value to Customer Acquisition Cost (CLTV to CAC; LTV/CAC) – The Customer Lifetime Value to Customer Acquisition (CLTV/CAC) ratio is a SaaS metric used to measure a company’s sales efficiency using the relationship between the lifetime value of an average customer and the average cost of acquiring that customer. The metric, computed by dividing LTV by CAC, is a signal of customer profitability and of sales and marketing efficiency. A ratio greater than 1.0 implies that the company is generating value. Inversely, a ratio below 1.0 implies that the company is destroying value. Investors’ expectations are that the CLTV/CAC ratio should fall within the 0.8 to 1.3 range with a clear path to achieving a ratio above 3.0x. However, the top performing companies achieve 3.0x to 5.0x. For more on this subject, you can read our article on Optimizing Your Customer Lifetime Value Calculation: SaaS Companies.
SaaS Magic Number – A SaaS metric used to measure a company’s sales efficiency using a ratio of New Subscription Revenue to Sales & Marketing (S&M) expense. Put another way, the Magic Number shows how much it costs to acquire $1.00 of subscription revenue. Any ratio above 1.0x means that your company generates more New Subscription Bookings than it spends to acquire the customer.
The most accepted formula is to use a ratio of the increase in ARR in the current period to the S&M expense in the prior period. The difference between the two periods should correspond to the length of the sale cycle. This is especially true for high growth, i.e. 3x annual ARR growth, companies. Investors’ expectations are that the Magic Number should fall within a narrow range around 1.0x with any ratio above 3.0x indicating a phenomenal operational leverage.

The Magic Number can be used for evaluating public companies with some adjustments. Public companies often do not publish their annual bookings numbers. Nor do they disclose the ARR at the end of the year, i.e. the Exit ARR. There are two ways in which to apply the Magic Number calculation if you do not have these two figures. Using year-over-year change in ARR, calculated using the subscription revenue in the fiscal fourth quarter and multiplying by four, will give a good proxy. As a reminder, the final quarter’s numbers will be found in the 10-K for that year, although you may need to subtract the first three quarters from the annual numbers to get to fiscal quarter subscription revenue. The second approach is even simpler. You take the year-over-year change in Subscription Revenue and divide it into the Sales and Marketing Expense for the prior year. Be sure to note the method used if you choose one of these two approaches.
The Magic Number often does not work well for Enterprise SaaS companies, especially in those below $50M in ARR. High variance in the length of the sales cycle, as measured by Average Days to Close, and wide variation among the Average Days to Close per opportunity make defining the “prior period” S&M expense difficult. Therefore, in such cases, we use the same period for comparison. The resulting metric is often referred as Sales Efficiency.
Sales Efficiency – An adaptation of the Magic Number for Enterprise SaaS companies. Long sales cycles and the variance in time of the sales cycles make defining the “prior period” S&M expense difficult. Therefore, in such cases, we use the Sales & Marketing expense in the same period as the New Subscription Bookings, whether actual or forecasted. For example, if you project $20M in New Subscription Bookings for a given fiscal year, then your Sales & Marketing expense should, in theory, be ~$20M to achieve a 1.0x ratio. Keep in mind the fact that ratios calculated in this manner will be lower than a Magic Number calculation exactly because you are using current period S&M expense. It would be very rare to see an Enterprise SaaS company achieve a 3.0x multiple.

Human Capital Efficiency (HCE) – The single largest resource cost in a SaaS business model is people, i.e. payroll and related items. A proxy for operating efficiency is the ratio of top line metrics, such as ARR, CARR or Revenue, to Employees. You can use any number of benchmark services such as the Key Banc SaaS Survey or the OPEXEngine SaaS benchmarking service for comparison. Keep in mind that the HCE varies proportionally to size – the larger the company the greater the scale – and does so more than other unit economic metrics.
The Rule of Forty (RO40) –The Rule of Forty postulates that a SaaS company’s combined growth rate and profitability should exceed 40%. The Rule of Forty acts as a yardstick that allows SaaS companies with a wide variety of go to market strategies to benchmark their growth. Some SaaS companies, particularly series B to C companies, seek to maximize growth to achieve breakout and dominate their space. Such companies spend heavily to realize the growth required to accomplish these objectives. More mature SaaS companies solidify their market positioning and typically seek to reduce their burn rates through pricing power and increased reliance on efficient upsells and cross sells strategies. The Rule of Forty also drives your financing strategy. SaaS companies pursuing category creation strategies may need higher levels of sales and marketing expense in the short term in order to achieve growth much later. Those seeking to build complex products may require above average R&D expense to bring their products to market. Enterprise SaaS companies fall into this category due to long sales cycles and extensive implementation processes. Such companies will perform lower on the Rule of Forty metric.
For the calculation, the growth rate is best measured using the year-over-year comparison of Annual Recurring Revenue, although Subscription Bookings is a valid approach. Profitability is best measured using the Free Cash Flow definition, which is the sum of the company’s annual growth rate and the Free Cash Flow margin.
SaaS Go-to-Market Metrics
Free-to-Paid Conversion Rate – Used in companies with a Freemium or Free Trial GTM strategy, the Free-to-Paid Conversion Rate is measured over time as the percentage of freemium users that convert to paid subscriptions and at point in time as the percentage of converted users divided by the total user population.
Marketing Qualified Lead (MQLs) is a lead that has been deemed more likely to become a customer compared to other leads. This qualification is based on the lead’s engagement with your brand and is often measured on response to inbound and outbound efforts, webinar attendance, web pages visited, marketing material downloaded, and similar engagement with the business’s content.
Sales Accepted Leads (SALs) are marketing qualified leads (MQLs) that have met certain agreed-upon criteria usually based on propensity or intent to purchase. Once the sales team has accepted these leads, Sales Development Representatives (SDRs) will contact the lead to confirm marketing’s assessment of the lead and to determine the degree to which the prospective customer fits with the Ideal Customer Profile. The SDR will also begin identifying the prospective customer’s employees who are most important to the purchase decision.
Sales Qualified Lead (SQL) is a lead that the Sales Development Representative has confirmed to fit the Ideal Customer Profile deemed ready for the next step in the sales process. The SDR will record the lead as an SQL and introduce the lead to the Account Executive. The actual introduction is typically a live call or video meeting between the Account Executive and the primary contact(s) at the prospective customer. The date of the call or meeting is the point at which the SAL should be considered an SQL for reporting purposes.
Sales Opportunity – An opportunity is a prospective customer at an advanced stage in the sales process with probability of closing that can be reasonably estimated. A typical set of opportunity stages looks like this: Prospecting (5% – 10%); Investigation / In Discussion (15% 30%); Proposal Price Quote (40% – 60%); Negotiation / Review (80%); Closed Won (100%); Closed Lost (0%).
Sales Pipeline – The sales pipeline is the value of all current opportunities. This metric is often shown as unweighted, meaning the dollar value of the deal, and as weighted, meaning the probability-weighted value of your opportunities.
Cost per MQL – Companies use this metric as an early indication of changes in customer acquisition cost.
MQL to SAL Conversion Rate – Tracking the MQL to SAL conversion rates reveals insights into the sales cycle process. The MQL to SAL conversion rate is typically a function of the marketing teams’ ability to target prospective customers. Highly relevant marketing campaigns will drive the prospective customers with a high intent to purchase and this will lead to high conversion rates. A low conversion rate may have one or more of the following causes: Low rates may indicate that the MQLs do not fit with the Ideal Customer Profile; the SDR may uncover information that was not readily apparent from the MQL information envelope. Another potential reason is a disconnect in the understanding of the Ideal Customer Profile definition between sales and marketing.
Timing also plays a role. Companies with a long Sales Cycle will only benefit from tracking conversion rates over time; tracking monthly rates will likely show volatility. Companies that serve early markets will find that MQL-to-SAL conversion rates will lag benchmarks as they build brand awareness and educate the market. In this situation as well, tacking conversion rates over time makes more sense than looking at performance in individual months.
SAL to SQL Conversion Rate – Tracking this conversion rate metric is just as important. This conversion rate depends heavily on the specific SDR whose personality and sales skills are as important as the level of the SDR’s training on the product, use case and competition. The number of SQLs generated per period of time is often a performance objective and is used for the basis of incentive programs such as Management by Objective bonuses (MBOs). Outside of the specific SDR, the specific conversion rate is also influenced by the individual contact person at the company. Being able to identify the employees with purchasing authority is key to ensuring that the lead converts to a SQL. Without the right contacts, the AE will ask the SDR to continue building the relationship and networking to reach the right people.
One quick note on the MQL to SAL to SQL process: High priority leads, colloquially called “hot leads” are routed directly to the Account Executive and thereby skipping qualification.
Sales Pipeline Coverage – This is the ratio of Required Bookings over the Target Bookings, with the latter defined by the Operating Plan (or Budget). A general rule of thumb for the Sales Pipeline Coverage metric is 4.0x. This means that a company should have 4 times as much ACV in its pipeline as its Target Bookings. This is a period-specific ratio meaning that the timing of the pipeline coverage ACV is measured against the period in which the opportunities are expected to close.
Average Days to Close – The average number of days for Marketing Qualified Leads to convert to Bookings. This period of time is also referred to as the Contact-to-Close cycle.
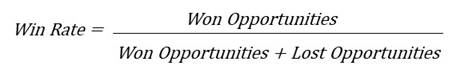
Win Rate – The ratio of Opportunities Won over the total opportunities in the sales pipeline.
Sales Velocity – The Sales Velocity metric shows how much revenue you are adding per day over the length of the sales cycle. It is calculated as the product of the number of closed opportunities, the average subscription ACV of these opportunities and the Win Rate with the result divided by the Sales Cycle.

Sales Representative Productivity – We use a variety of metrics to measure productivity, but the most common are the following:
- Quota Achievement: % of quota attained for a given time period in aggregate and by rep
- Participation Rate: % of reps that achieved quota
- Win Rate by rep: Closed/Won Opportunities divided by All Opportunities as defined above
- Sales Ramp: Time to reach high quota attainment, typically defined as consistent Quota Achievement > estimated team productivity as defined in the sales capacity planning model
- Sales Rep recruiting / attrition (regrettable and non-regrettable)
Types of Sales Representatives
Account Executive (AE) – The Account Executive is the key customer facing member of the Direct Sales team, responsible for closing deals to create new customers. AE’s earn a base salary and a commission on the sales of the company’s product. The sales commission compensation is designed to generate 50% of the AE’s total earnings if the AE meets a specific sales target, called a quota. The Sales Quota is almost always an annual target. If the AE exactly meets the Sales Quota, then the total earnings are referred to as On-Target-Earnings, or OTE. At OTE, 50% of the total compensation comes from salary and 50% from sales commission. The OTE is a key metric because the annual quota is set at a multiple of 4 to 6 times OTE. This ratio is important because it drives the main cost component in sales and marketing.
Enterprise SaaS companies build complex products and sell into large corporations. The sales process requires building relationships with key decisionmakers inside the organization, developing an understanding of the organizations technology needs, educating the organization on the value add of the product, advising the organization on the integration and implementation, and getting the organization to purchase the product. This period is known as the Sales Cycle. Managing the Sales Cycle requires a senior sales representative with 2 to 5 years of quota-carrying sales experience plus another 2 to 4 years of entry-level sales experience. Enterprise SaaS company AE’s earn between $200,000 and $300,000 at OTE depending upon the annual Sales Quota.
Sales Engineer – SE’s support the Account Executives by facilitating sales opportunity discussions with deep technical expertise on the product. The SE helps the prospective customer to better understand the product functionality, assess the customer’s equipment needs and to determine system requirements. Job titles for this function include solutions engineer, solutions architect, systems engineer, customer engineer, pre-sales consultant, technical account manager, applications engineer and field applications engineer.
Inside Sales Representative (ISR) – The term, Inside Sales, refers to the process of closing deals remotely without the live, face-to-face engagement of the direct sales approach. The onset of the pandemic made all selling remote, so this is no longer an accurate distinction. Today, the better definition is to describe Inside Sales as the use of lower cost sales strategy leveraging people who do not need the selling skills of Account Executives combined with a robust digital marketing lead generation program. The marketing campaigns generate contact information of potential customers who demonstrate interest through some behavior such as attending a webinar or responding to a call to action message. The objective of these marketing campaigns is to increase brand awareness and further customer education to move respondents closer to a sale. The Inside Sales representative then reaches out to each interested customer and attempts to move them to a paid subscription. The Inside Sales strategy is successful if the combination of the digital marketing campaigns and the Inside Sales Representative (ISR) results in greater sales efficiency than either a Direct Sales or an all-digital marketing strategy.
The average ISR has 2 years of work experience. They work for an average base salary of $60,000 with an average On-Target-Earnings (OTE) of $120,000. The percentage mix between base and variable is roughly 50/50.
The ISR’s work is far more predictable and regulated than that of an AE. Each day the ISR has a set of targets to accomplish. These include sending emails and making phone calls to potential customers on contact lists. Each month the ISR is measured on opportunities created and opportunities converted to paying customers. Variable compensation is often based on meeting daily and month activity targets and sometimes in lieu of commission on new deals.
Sales Development Representative (SDR) – SDR’s support Account Executives by prospecting for Sales Opportunities and nurturing these leads to the point where AE’s can work with them on closing the deal. This activity can be outbound in that the SDR directly contacts decision makers at potential customers by phone or email. Or it can be an inbound activity in that the SDR responds to emails or phone calls from prospective customers. At the point of contact, the SDR seeks to determine if the potential customers’ software needs fit the company’s software product. If there is a match, then the SDR will pass the lead to the AE. The Sales Development Representative earns a base salary of $50,000 in high-cost metropolitan areas and a $20,000 variable that is typically based on sales activity (instead of sales commission).
Business Development Representative (BDR) – In larger organizations, the SDR job transitions into separate roles that manage inbound and outbound activities. The SDR will focus exclusively on qualifying inbound leads in support of the AEs. The BDR assumes the role of outbound activities, leverage emails, phone calls, and social selling tools to add Sales Opportunities in the pipeline. The BDR compensation is similar to that of an SDR.
Sales Capacity Plan
For Direct Sales, the expected annual production is forecast using a Sales Capacity Plan. The output is a function of (1) number of quota-carrying sales representatives, i.e. Account Executives (AE); (2) their Quota expressed in Annual Contract Value (ACV) for both subscription and non-recurring revenue such as professional services; and (3) their Productivity, expressed as a percentage of total expected annual production. The Productivity factor is a conservative assumption we use to account for lower than expected Bookings. It takes into account the likely variability in performance among AE’s.
Adjustments are made for Account Executives with shorter tenures and, therefore, are still ramping, i.e. Ramping AE’s. Typical ramp time is nine-months, with a percentage of fully ramped production estimated at each subsequent month. For example, new AE’s may have no production in the first quarter after their start date, begin to generate small volume in their second quarter of employment and this could be 25% of total quota, and ramp to 75% of annual quota in their third quarter. In their fourth quarter of employment, these AE’s will be responsible for their full quota.
Additionally, you should adjust for seasonality if your business experiences it.
The term, Over-Assignment Factor, is sometimes substituted for Productivity. It’s a similar concept with the important exception that the terms are the inverse of one another.
Sales Commission Rate
- Direct Sales Commission Rate – The percentage of the Bookings value earned by an individual Sales Representative for closing an opportunity. The rate will vary between software subscription, subscription services and non-recurring services. Sales Commission Plans or Sales Incentive Plans (SIPs) offer various incentives that increase the sales commission rate if certain criteria are met. The following two components are involved in calculating the Direct Sales Commission rate: Base Commission Rate (BCR) – This is the sales commission rate earned by sales representative for closing Bookings contracts and is calculated as a % of the Bookings value.
- Accelerator – The Accelerator is an additional percentage added to the BCR for all Bookings above a certain amount, which is usually the sales representatives’ quota.
Loaded Sales Commission Rate – The percentage of the Annual Contract Value earned by the individual Sales Rep as well as all qualified team members for closing an opportunity. Other members of the sales team typically include sales management, sales operations and sales engineers. Companies with a sales partner (Partnership, OEM, Channel) strategy will incentivize the appropriate team to avoid conflicts between direct and partner channels.
SaaS Marketing Channels
The term Marketing Channels refers to the wide variety of ways in which to reach potential customers. The channel types range from traditional means such as print, radio, and television to live in-person and virtual events to digital marketing. Traditional marketing channels are dominated by high budget marketing departments at large corporations, leaving little room for emerging companies. Digital marketing is best suited for the latter because it is a more cost effective solution.
Digital Marketing is a broad term because it refers to all online channels used to access potential consumers. It forms an essential part of the go-to-market strategy. We can subcategorize Digital Marketing into several groups.
Search Engine Optimization (SEO) – SEO refers to the optimization of your company’s website for maximum visibility to search engine algorithms. The objective is to get your website ranked highly for searches using user keywords that you do not purchase. These non-sponsored website listings are known as organic listings and prospective customers who click on these listings are referred to as Organic Leads. The leads are free; the cost is in the website optimization.
Search Engine Marketing (SEM) – Search engine marketing refers to the use of paid advertisements that appear on search engine result pages. Marketers bid on keywords that trigger paid advertisement placement in search results. These leads are called Paid Leads. The single largest provider SEM vendor is Google through its Google Ads product. Google Ads allows marketers to identify keywords that match the demographic they seek and to place bids on those with the best fit. Facebook allows marketers to run campaigns through its Ads Manager platform. LinkedIn’s service is Campaign Manager.
Digital Advertising – Digital Advertising is the practice of purchasing space on websites to run static or video advertising. Originally referred to as banner advertising due to the selling of the website header space and now called Display Advertising or Sponsored Content, Digital Advertising is typically among the lowest cost Digital Marketing channels because it has limited demographic targeting data.
Direct Notification – This term refers to email, mobile numbers (SMS/text), and push notifications used to acquire potential subscribers and maintain engagement with current customers. Contact lists are purchased from third-party vendors and collected by the company itself at events such as symposiums, trade shows, panel discussions, and webinars. Email marketing continues to serve as the primary Direct Notification means. However, mobile and push notifications are growing in popularity because this tactic uses customer behavioral data to enhance conversion rates.
Content marketing – Content marketing refers to the creation of proprietary content for social media posts, company-hosted blogs, v-blogs, podcasts and webinars, articles, white papers, and any other material that will capture and maintain the attention of consumers, both before and after the sale. Companies use this tactic throughout the customer journey. Social media content introduces customers to the brand, i.e., Brand Awareness. It serves only to get the company’s name and business in front of the decision maker. More in-depth content focuses on the product’s value add and therefore provides Customer Education. Technical content such as whitepapers and case studies are designed for potential customers with a high degree of intent to purchase. Once leads convert to paid subscribers, the onboarding team (typically the professional services or customer success organizations) provides specific content tailored to the customer’s use case and skillset. Often, the customer decision maker will need higher level content for the purchase and the end users need help understanding the how to best use the product for maximum value-add. These activities are typically referred to as Training and Enablement and marks the boundary between marketing and customer success. Finally, as the end users become experts, content still plays a role in furthering their education, thereby increasing engagement and ultimately retention.
Social Media Marketing – At its most basic, this channel involves establishing a presence on social media and engaging with prospective and current customers alike. Many companies find that their customer engagement is really customer support because disgruntled customers bypass traditional helpdesk features to reach the company. While it’s important to have a presence, utilizing this channel for lead generation will depend heavily on the specific buyer persona.
Affiliate Marketing – Nearly all companies secure Distribution Partners or Affiliate Partners that manage a network of websites. SaaS companies will give the partner a specific link to post on their sites. Affiliates are paid for lead generation. Payment method varies from revenue sharing or pay per sale (PPS) to cost per action (CPA), and Cost per Click (CPM, referring to the pricing in cost per thousand clicks).
Influencer Marketing – Influencers are individuals who have established a credibility among a specific demographic and who can wield this credibility to drive purchase decisions. In this way, influencers provide products with Social Proof, a term coined by author Robert Cialdini in his 1984 book on persuasion and marketing, Influence: The Psychology of Persuasion, to describe this conveyance of credibility. In marketing, a relevant influencer is often someone with a social media presence and a large number of followers. Influencers also come from industry or academia. Influencer Marketing refers to the use of influencers to promote a product. The financial relationship typically takes the form of payment for a product testimonial woven into the influencer’s content whether it’s an Instagram feed, a YouTube video, or podcast.
Types of Partnerships
As a Go-To-Market strategy, developing Strategic Partnerships with other companies can make a huge impact in lowering Customer Acquisition Costs and in achieving scale earlier in the company’s lifecycle. This strategy, also called a Channel or Business Development strategy, takes many forms with a wide variety of complexity depending upon the company’s competitive environment, maturity and specific goals and objectives. At the highest level, a Strategic Partnership is an agreement between two companies to generate incremental sales for each party. I use four categories to define partnership opportunities: Co-Marketing; Affiliate; Co-Selling; and Reselling.
- A Co-Marketing program requires the least effort and, consequently, entails the least revenue upside. In this arrangement, you associate your company with another player in the same space with similar target customers by collaborating on marketing events and content creation
- An Affiliate program involves a fee for referral arrangement with third parties that are in contact with the target customers. The Intuit QuickBooks Affiliate Program serves as a prime example. The program pays registered partners a fee for new customers and new leads. Partners place the QuickBooks logo and link on a web page and are paid when customers use this link to engage with Quickbooks either as paid subscribers or free trial users.
- Co-Selling Partnerships involve an agreement between two software companies to sell each other’s product to the same target customer, often at the same time. The Direct Sales teams from each company generate and share Sales Opportunities, although the level of cooperation will vary.
- Reselling Partnerships involve a partner that distributes the product on behalf of the SaaS company. In effect, the distribution partner purchases the SaaS company’s product and sells it at a marked-up price to the customer. The customer contract is with the distribution partner; the SaaS company has no legal relationship with the customer. Resale partners are typically software vendors, Managed Service Providers (MSPs) and system integrators (SIs) and professional service firms.
Ideal Customer Profile (ICP)
An ideal customer profile, also referred to as the buyer persona, is a hypothetical description of the type of company that would most value your software, have the most efficient sales cycle, the higher customer retention and expansion rates and the highest number of evangelists for your brand. You define the ideal customer profile using firmographics, some of which include: (1) product fit, i.e. they have a problem that your software solves; (2) size, either in revenue, budget; # of employees, # of locations, etc.; (4) sector, i.e. industry vertical; and (4) location;
Buyer Type
The term Buyer Type refers to the specific role and level of the decision maker(s) that work for the ICP company. When Investors ask, “who do you sell to?”, they are typically referring to the Buyer Type. The specific decision maker will depend upon the product. For products that offer a functionality for a specific process, such as sales commissions, tax compliance, or contract management, the decision marker will be the head of the department charged with managing that process. In these cases, the CFO is the Buyer Type. Broad functionality, enterprise products with technical integrations will require the CTO’s review.
SaaS Professional Services Metrics
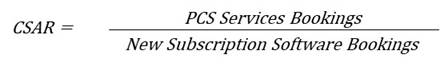
Professional Services Attach Rate – The Professional Services Attach Rate, PSAR, measures the Professional Services Bookings Value divided by Total Subscription Software Bookings.

Professional Services Value Equation – The Professional Services Value Equation” (or PSVE) score incorporates post-sale expansion and improved retention into the PSAR equation. It is defined as PSAR + Expansion Rate + Customer Success Attach Rate (CSAR). The CSAR is the most variable of the three inputs since it is an objective measure of increased retention.
![]()
Time to Go Live (TGL) – The time it takes to complete implementation and get customer live on the product. The TGL date is often used as the revenue recognition date for enterprise SaaS companies because the company fulfills the delivery requirement in addition to other revenue recognition elements – evidence of a contract, fixed or determinable price and reasonable assurance of payment.
Time to Value (TTV) – The time it takes to get customer to realize full extent of value from the product. The TTV definition depends upon the specific service you sell. Here’s one example: Consider an enterprise SaaS business that sells a subscription license based upon seats and that the average customer buys 50 seats. Upon implementation, only a fraction of the seat licenses may be in use, say 10. We refer to these the seats as active and the remainder inactive. The customer success team will attempt to grow the active seat count to the full subscription license of 50 seats. In this case, TTV could be the date at which all 50 seats are in use.
Time to Grow (TTG) – The time it takes to expand the ACV of the customer via upselling and / or cross-selling.
New Feature Adoption – This metrics straddles Professional Services and Customer Success because one of the other (or both) of these departments can affect this metric. The New Feature Adoption can be measured as the median time it takes for all, or some target level, of the products’ users to adopt the feature and the percentage of users who utilize the new feature. As the feature matures, then you should use traditional Customer Success metrics to measure engagement.
SaaS Customer Success Metrics
The ultimate objective of using Customer Success metrics is to determine the value add that your company provides to the customer. The true measure of value add is the customer’s return on investment in your product. This analysis is difficult, if not impractical or even impossible, to estimate. So, we utilize a broad array of metrics that provide an indication of the value we are adding.
Customer Success Attach Rate (CSAR) – The CSAR measures the Post Contract Support, or PCS, Bookings associated with a specific contract.
Daily Active Users to Monthly Active Users (DAU/MAU) – The DAU/MAU ratio is a measure of customer engagement. A high DAU/MAU ratio among end users implies that customers use your app frequently. The inverse is true for a low ratio.
DAU/MAU is used by Enterprise and Small/Mid-Market companies in a context that is different than that for Business-to-Consumer companies. Enterprise and SMM customers track the end users, i.e. the customers’ employees. B2C companies track the activities of their direct customers. It is important to understand the context when employing DAU/MAU.
There are some pitfalls to be aware of in using this metric, it is very important to ensure that the DAU/MAU ratio is a function of value add to the end user. If Enterprise & SMM SaaS companies find that users spend a lot of time on the app, but that they fail to achieve productivity gains, then the app is not adding value. In fact, it may be hurting productivity if the end users are using the app to the detriment of other work, thereby decreasing productivity. For B2C companies, achieving a high DAU/MAU ratio may be good unless users show light usage; this implies that users are not getting a lot of value from this activity. As another example, B2C companies may have high DAU/MAU, but are not able to monetize this activity. A final caution for B2C companies is that the composition of DAU may be weighted toward new users and this would imply high churn rate.
We can find a benchmark in a Tumblr post by Sequoia Capital’s Jim Goetz, who stated that, “the industry standard is between 10% and 20%, and only a handful of companies top 50%”[1]. Communication app, WhatsApp, operates at a 72% DAU/MAU ratio, indicating a high degree of engagement.
Once you have a handle on DAU/MAU, you should look at specific metrics that add more detail to the DAU/MAU. These include:
- Number of sessions per day per user – This metric is typically defined as the number of logins per day.
- Time spent on the product per day and per session on a per user basis – This is often a good measure of end user engagement. One word of caution though: the time spent in the product may not equate to value add. If your application simply allowed a company to move a function online but has not made users significantly more efficient, then you are not adding value. So, do not be fooled by a high time spent on the product metric.
- Number of events per day per user – In this context, the word “event” refers to any activity undertaken by the user. For an Enterprise SaaS marketing technology company, an event may be the running of a specific marketing campaign. For a SMM SaaS project management software company, an event may be the publishing of a project management instance. For a B2C SaaS survey company, an event may be the distribution of an individual survey.
User Retention by Time Period – B2C SaaS companies that operate in spaces with low barriers to entry, low switching costs and high number of substitutes closely track the performance of monthly cohorts with a cohort as defined by the number of customers acquired in a given month. Such consumers can be fickle and may churn out quickly. Therefore, you must monitor the slope of the retention curve over the subsequent month. One way to report on this curve is to use a set of metrics defined by the percentage of users active as time progresses. For example, the metric, D30, refers to the percentage of active users that were acquired in the prior month, i.e. Month 0, on the 30th day of the following month, i.e. Month 1. You will see every variety of this metric: D7, D15, D30, D60 in days; W1, 2, 3 etc in weeks, and M1, 2, 3 etc in months.
ARR to End User or MRR to End User (AEU or MEU) – Enterprise SaaS companies use this metric to evaluate the value add of their service if the pricing is based upon end user count. The calculation is simply the ARR or MRR divided by the active end user count. If a service is properly priced, the price per user seat will tell you the true cost of your solution for your customer. The greater the number of active end users the lower the cost per seat for the customer and this indicates a higher degree of engagement and a higher value add. Take special care in defining an active user as one would when doing so for the DAU/MAU calculation.
Net Promoter Score (NPS) – The Net Promoter Score is a measure of customer satisfaction metric that measures a customer’s likelihood of recommending a company. Customers are prompted to quantify this by ranking their probability a scale from 0 to 10, with 10 as the highest probability to make a recommendation and 0 the lowest. Individuals who answer with a score of 0 to 6 are called Detractors. Those who answer with a score of 9 or 10 are called Promoters. Customers who select 7 or 8 are called Passives. The NPS is calculated by subtracting the percentage of customers who are Detractors from the percentage of customers who are Promoters. Passive responses are included in the denominator when calculating percentages. The result of the calculation is expressed as a simple number. Soliciting Net Promoter Scores from customers is considered best practice for Customer Success management.
Customer Satisfaction Score (CSAT) – The Customer Satisfaction Score differs from NPS in that CSAT measures customer satisfaction with the company’s service, whereas NPS measures customer loyalty. Additionally, CSAT questionnaires use service-specific questions that focus on aspects of the customer’s experience, e.g. “How would you rate the user interface?” and typically include multiple questions.
First Response Time – Customer support response time is a leading indicator of customer satisfaction. It is a function of customer support staffing and training.
First Contact Resolution Rate (FCR) – The FCR represents the percentage of customer support calls that are resolved in the initial call. You can use this metric to get insight into customer engagement and satisfaction, product functionality and skill level of the customer support team because the FCR is a function of all of these factors. The challenge is to identify the specific drivers of the FCR.
Escalation Rate – The Escalation Rate is the percentage of customer inquiries that require follow up support such as researching a customer reported product issue. Although the Escalation Rate is just the opposite of the FCR, it’s nonetheless important to track because the specific drivers can provide insight into the customer use cases and identify product functionality that needs to be incorporated into the product road map.
Customer Retention Cost (CRC) – The CRC is the CAC equivalent for managing customer retention and engagement. Customer Success organizations and strategies vary widely from one company to another and this makes precise measurements difficult. Plus, there are not commonly available benchmarks for CRC. Still, you should attempt to incorporate CRC into your financial reporting if the precision validates the cost of measuring it. Costs that should be included in CRC are,
- Customer Success Team salaries and wages, benefits and taxes, stock-based comp and allocations for overhead and facility expenses
- Post-Contract Support activities designed to improve on-going customer engagement such as on-site training and end user marketing (blog posts, email campaigns, webinars) as well as any software required to support these activities. Add in payroll costs for employees that are not classified as Customer Success team members.
- Salaries and wages for any employees that engage customers directly for issue resolution should be included. Engineers are often pulled into customer conversations when the discussions require specific technical expertise. If such interaction is common and occurs with some consistency from period to period, then the CFO should estimate the amount of time spent on these activities and include them in the CRC calculation. To compare and contrast these activities, your company should have a recurring meeting for Customer Success team to educate the R&D team on the ways in which customers are using the service. This allows engineers to incorporate customer behavior learnings into the product roadmap. These activities should not be included in the CRC.
SaaS Strategic Metrics
T2D3 – T2D3 is a rule of thumb that defines best in class revenue growth. It postulates that from revenue in single-digit millions, revenue growth should triple for the first two years, then double for the subsequent three years. For example, a company that reaches $2M in revenue in year 0, should grow to $6m in year 1, $18m in year 2, $36m in year 3, $72m in year 4 and $144m in year 5. This thumb rule is based upon growth trajectories achieved by 50 hyper-growth technology companies.
Growth Efficiency or Growth Efficiency Index (GEI)
The Growth Efficiency or Growth Efficiency Index metric is another rule of thumb. In my experience, I find application of this method somewhat useful for private SaaS companies, but only as another parameter to augment your growth analysis. The main use case is in estimating burn rate at any given growth rate. The main shortcoming is lack of consensus on the standard, although blog posts suggest a figure of 1.0. Also, we can also use a variety of other methods to benchmark your company’s burn rate.
The equation is as follows:
![]()
We can use the T2D3 rule to frame an example. Let’s assume that a company grows 3x annually from $6M ARR to $18M ARR resulting in $12M of Net New ARR. The GEI suggests that you can burn $1M per month to achieve this growth.
Public SaaS companies produce highly variable metrics that are not useful. For example, Elastic NV has a GEI of 11, while Dropbox has a GEI of -2.3.
Capital Consumption Ratio
I first encountered this metric in the Key Banc Capital Markets, KBCM, (formerly Pacific Crest) SaaS Survey. The author, David Spitz, defines it as the total capital consumed, both equity and debt, to date divided by the ARR achieved at that date. Expressed as a formula gives,
![]()
It is essentially a way to track progress toward profitability and is most useful for late stage companies as they attain scale and approach profitability. You can see this use case in the KBCM survey data. The Capital Consumption Ratio shows a steady median ratio of 1.5x for companies with as little as $5M in ARR all the way to $75M. Additionally, the variance around the median declines as the ARR approaches $75M indicating that this metric does not provide an effective benchmark for companies with ARR less than $75M. The metric drops sharply to less than 1.0 for companies with ARR above $75M and this trend evidences scale in the business.
SaaS Quick Ratio – The term, Quick Ratio, is a finance concept that provides a simplistic metric for a company’s liquidity and is defined as Liquid Assets divided by Current Liabilities. Any number greater than 1.0 is good. In SaaS parlance, the Quick Ratio is a metric in that it’s simple and uses 1.0 as a benchmark. It differs in that the QR is a growth metric calculated as the dollar growth in recurring revenue divided by the loss of recurring revenue. The specific calculation is as follows,
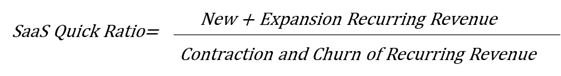
…where Recurring Revenue can be either Annual or Monthly.
Total Addressable Market (TAM) is the total market demand for your service. For your company, it will refer to the total amount of money you can make in selling your product as it exists today. For fundraising, you will need to conduct a TAM Analysis, which should provide a detailed estimate of the market you intend to serve. Remember that the TAM will grow over time. You should incorporate these growth expectations into your strategic thinking.
Serviceable Available Market (SAM) is the segment of the TAM targeted by your service which is within your geographical reach. The served available market gives you a much better sense of how much revenue you can realistically bring in with your product, but the TAM is useful in indicating how much room there is for potential growth.
Serviceable Obtainable Market (SOM) is the portion of SAM that you can realistically capture. The SOM is typically defined by the market share for your specific service versus all other competitors with a comparable offering.
[1] Goetz, Jim, tumblr.com 2/19/2020 https://sequoiacapital.tumblr.com/post/77211282835/four-numbers-that-explain-why-facebook-acquired

Eric Mersch
Eric Mersch has over 25 years of executive finance experience including twice serving in public company Chief Financial Officer roles. Eric is an equity partner at FLG Partners where he works as an Interim CFO to venture and private equity portfolio companies, specializing in Strategy and Operations, Strategic Planning, Equity…Read More