By Eric Mersch
I have written extensively about SaaS business model classification. My articles highlight the key operational differences that drive strategic decision making for SaaS businesses as well as the relevant key performance indicators for management and reporting.
This article focuses on the Business-to-Consumer SaaS business model. Specifically, we will discuss their typical financial profile, B2C SaaS performance metrics and highlight these using B2C company example: Dropbox.
OVERVIEW
Business to Consumer (B2C) SaaS companies provide software services tailored to individuals. Some are lifestyle companies such as personal financial lifestyle application, Mint and meditation application, Calm. There are also a whole host of B2C business management tool providers such as Calendly, Docusign, Dropbox, Hootsuite, Hubspot, Mailchimp, SurveyMonkey and Zoom. Any company that provides a service to an individual user has a B2C component to their business model even if it sells to businesses.
Note, for purposes of this article, I’m excluding media companies such as NetFlix, Disney+, Hulu, Spotify, Pandora, YouTube and Twitch, gaming companies such as Playrix and GameLoft and news outlets such as the Wall Street Journal and the New York Times because these are B2C subscription companies. Certainly, software is part of the service delivery, but content is the primary value-add for users of these digital channels. Many of these companies also monetize their content with transaction fees such as pay-per-view content and in-app purchases and these are non-recurring revenues. As such, these subscription-based content companies do not make good comparables for evaluating the SaaS business.
B2C SaaS companies serve markets characterized by low barriers to entry and low switching costs. Free offerings such as Free Trials and Freemium programs make it easy for consumers to engage with the tool. Simply entering a credit card number facilitates customer onboarding. But, it’s also easy for customers to leave. Billing is monthly and this means that consumers can easily cancel subscriptions. This often happens when consumers receive their credit card bill, which reminds them that they are paying for a subscription that may no longer be valuable. This is why you will see a spike in cancellations mid-month. Given these industry dynamics, it is important for B-2-C SaaS companies to both acquire and retain paying customers
B2C SaaS companies employ Go-To-Market strategies to drive Brand Awareness as the entry point to access potential consumer leads. More specifically, these companies match heavy Digital Marketing with Free Offerings.
Financial Profiles and SaaS Metrics: B2C SaaS Companies
Gross Margin
B2C SaaS companies generate high gross margins because direct costs are so low. The services of B2C companies are “self-provisioned” by customers who have very little access to support services. These businesses offer lists of Frequently Asked Questions (FAQs) for example which require low upfront investment and very little maintenance. Blog posts do require routine updates; but this is part of these company’s content management strategies and, therefore, incur associated costs in sales and marketing. Most companies augment FAQs and blogs with a very limited support activities usually provided by staff operating out of low-cost locations via live chat. Hosting and connectivity are the largest component of Cost of Revenue, but levels of consumer activity typically don’t require heavy costs for computing, bandwidth and storage. At scale, with strong execution, B2C companies should generate gross margins above 75%. The low incremental cost to serve each customer is important because it allows for a higher Digital Marketing spend and the ability to support Free Offerings as discussed below.
B2C “Working Capital Trough”
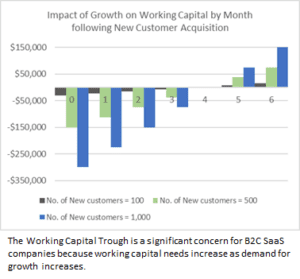
B2C SaaS companies’ reliance on monthly subscriptions has a significant impact on their working capital needs. This is due to the fact that the company invests in customer acquisition initially (in one reporting period) but earns back that investment monthly over several subsequent months. And, worse, the higher the growth rate of the company, the greater the working capital needs are of the company. This effect is known as the Working Capital Trough.
 Take for example a B2C SaaS company that develops and sells subscriptions on a monthly basis. Assume the company sells an annual software subscription at $1,200 and that this price point ensures an annual gross margin of 75%. And, assume that the company spends $300 to acquire an individual customer (CAC of $300). Each month, the company earns $100 in revenue and $75 in gross profit from a single customer. This level of profit allows the company to recover all of its customer acquisition investment cost in four months.
Now, let’s assume that the company can continue to acquire each customer for $300 at any volume (e.g., working capital investment requirements increase by $300 for each new customer). In this scenario, the company needs $30,000 to acquire 100 customers, $150,000 to acquire 500 customers, and $300,000 to acquire 1,000 customers as shown in the chart. The Working Capital Trough deepens with increased growth.
Now, let’s look at the relationship between the Working Capital Trough and new ARR. Under the three examples above, adding 100 new customers increases ARR by $120,000; adding 500 customers increases ARR by $600,000; and adding 1,000 customers increases ARR by $1,200,000. By comparing the incremental new ARR to the Working Capital Trough, you will see that the new ARR increases by a factor of 4 times the investment in acquiring new customers.
 An obvious approach to temper the depth of the Working Capital Trough is to introduce quarterly or annual payments. The impact of quarterly payments is minimal. The depth of the trough and the breakeven month will be the same. Annual payments, on the other hand, make a significant difference. Using the same assumptions above for a B2C SaaS company with a $1,200 ACV, 75% gross margin acquiring 100 new customers in a given month at a $300 CAC, the impact on working capital is readily visible. Even by increasing the mix of annual payments to just 20% of total Billings, shortens breakeven by three months.
The takeaway here is that B2C SaaS companies should consider offering annual payments in lieu of monthly payments. The impact of the annual billing is so great that it allows plenty of room for sales incentives. In the example above with 20% annual Billings, holding all other assumptions constant, the company could offer a pricing discount of up to 28.57% and show the exact same breakeven point as in the 100% monthly payments scenario. In the real world, Hubspot offers a 10% discount for annual pre-paid subscriptions. [Note that a 10% discount in our scenario does not change the breakeven month although the slope of the line is 15% lower.]
These exercises assume that there is a 1:1 relationship between CAC and new customer count as the number of new customers acquired in a given month grows. In reality, as the company seeks to add more customers in each period, the company will find that CAC will grow exponentially. Each incremental customer will cost more than the prior customer. The effect is called the Law of Diminishing Returns. This is an economic principle that states that each unit of incremental investment results in a lower return on investment. There are two main reasons why this theory applies in the case of customer acquisition costs. The Total Serviceable Market (TSM) is smaller than the Total Addressable Market (TAM) and readiness to engage varies among targeted consumers.
- Competition for the company’s users reduces the pool of target consumers. Competing companies will run marketing campaigns at the same time and may pick up consumers who would normally respond to your marketing and this reduces the size of the Total Serviceable Market (vs TAM). Strength of brand and depth of relationship with potential consumers are material influence as are the timing of the campaigns and the channels in use. As the pool of target consumers shrink, the cost to acquire them increases.
- The TSM is defined as the total set of customers in a given period with a propensity to engage with the product. But customers within this data set have varying propensities to engage. Some may be actively looking to engage already and quickly respond to a marketing campaign. Some of those looking to engage may receive the marketing campaign at the wrong time – they may just be busy. Others may be interested in the product but may not have the awareness or education that would allow them to engage.
As a result, Customer Acquisition Cost increases exponentially as companies strive to acquire increased numbers of customers. The chart below demonstrates this effect. In our above example, we assumed that each customer can be acquired for $300. As the chart shows, this company is able to acquire the first customer at $300, but then needs to increase spending to acquire each additional customer, paying $384 for the 500th customer and $510 for the 1,000th customer. The higher CAC will push out the breakeven point, exacerbating the company’s working capital needs.
 For the CFO, mapping the relationship between the investment in new customer acquisition and the resulting new customer count and ARR is a critical tool for understanding the incremental cost of acquiring each subsequent customer. The focus should be on the slope of the line, which will give insights into the Total Serviceable Market and the competitive pressures at work.
Further, the CFO needs to track the consumer response to each Digital Marketing campaign. Target consumers will respond in one of three distinct ways: Some percentage “x” will not respond to this specific campaign. Some percentage “y” will choose the Free Offering. And some percentage “z” will go straight to purchasing subscriptions. The combination of x, y and z will add to 100%. See the nearby flow chart for illustration of this process flow.
Of those who choose Free Offerings, some percentage, represented by CR%, or Conversion Rate percentage, will convert to paid subscriptions. It’s important to note that the CR% differs dramatically between Free Trial and Freemium. Free Trial consumers typically convert at 60% while Freemium consumers will convert at 10% – 20%. The Conversion Rate should be tracked because lower than benchmark performance indicates that your TSM is lower than you expected and that you are overspending on an individual marketing campaign. This analysis will also help you evaluate the efficacy of a Free Trial compared to a Freemium offering.
Understanding these four metrics will allow the CFO to calculate the performance of each individual Digital Marketing Campaign and report the Return on Investment for each. Each ROI data point should be aggregated for all campaigns to show the ROI of the Digital Marketing budget. Knowledge of these metrics enables the CFO to collaborate effectively with the CMO to better manage marketing investment decisions. For more about B2C Go-to-Market strategies and measuring ROI of Inbound Marketing and Digital Marketing strategies, please read my previous article on this topic.
Using B2C SaaS Metrics for Performance Management
Customer Lifetime Value to Customer Acquisition Cost (CLTV/CAC)
The Customer Lifetime Value to Customer Acquisition Cost (CLTV/CAC) is the key performance indicator for B2C SaaS companies. More specifically, CFOs need to calculate this metric by customer cohort, usually defined as the types of customers acquired in a given month. Because the SaaS sales cycle is typically less than one month, sales and marketing expenses can be closely matched to new customers acquired. Once the level of customer count becomes statistically significant, then the customer lifetime can be precisely defined, completing the necessary components for the CLTV/CAC calculation.
The effectiveness of free offerings in generating revenue should be monitored for their conversion rates of free to paid users, the average amount of time a customer takes before converting and the level of user engagement while using the free offering.
B2C companies should be particularly careful when managing free offerings because customer acquisition cost should always include the cost-of-service delivery (such as the computing, bandwidth and storage costs). Note, because these costs are often buried in the Cost of Revenue, they may not therefore typically show up in Sales and Marketing. And, while gross margin is a component of CLTV/CAC, it’s not included in the Magic Number calculation.
B2C SaaS Company Example: Dropbox, Inc.
Go-to-Market Strategy
Dropbox was founded in 2007 to provide an online file storage hub for consumer data. Although several B2C storage companies launched around this time, Dropbox differentiated itself with a product feature that listed files stored online alongside files stored locally, i.e., on the consumer laptop. For Microsoft users, their Dropbox-hosted files appeared in the File Explorer app exactly as did their laptop files. While competitors required users to login to unique websites with proprietary features, Dropbox allowed users to interact with its product in the exact same way in which they were already doing. The key learning here is that Dropbox did not require a change in behavior on the part of the customer, thereby simplifying adoption. And this product-driven Go-To-Market approach allowed the company to emerge as a leader in this space.
As it gained experience in this space, Dropbox realized that customers used the product to collaborate with others, whether or not these individuals had active Dropbox accounts. Dropbox’s free offering allowed non-users to sign up and view shared documents, thereby embracing the network effect driven by the sharing of files. Users further pushed the network effect as they changed jobs and interacted with separate sets of non-users.
In addition to product differentiation, Dropbox’s free offering was another key to the company’s growth. Dropbox aggressively markets to free users with mail marketing, in-app notifications, and discounts for converting to paid subscriptions. Over 90% of all paid subscribers convert from the free offering.
Dropbox is a good example of a B2C SaaS company not only due to its use of a free offering but also because it has other attributes that closely match our B2C definition. Average Annual Contract Value was $1,604 in fiscal year ending December 2021, well below the $10,000 maximum for B2C SaaS companies per our definition. The product is a point solution, meaning that it solves a specific user problem. Users self-provision the product without any services.
Dropbox uses the term Average Revenue per Unit (ARPU) with unit defined as a single customer. For the four years 2018 to 2022, Dropbox reported ARPU of $117.64, $123.07, $128.50 and $133.73 respectively. This is a relatively low price point and Dropbox’s ability to increase user monetization is also limited as evidenced by its ARPU growth, which was 3.3% on a Compounded Annual Growth Rate (CAGR) basis for these four periods. To grow top line revenue therefore, Dropbox focuses on new customer acquisition. For these same four fiscal years, Dropbox grew paying user count more than two times faster than ARPU with a four-year compounded average growth rate of 7.2%. This growth strategy is very common among B2C companies.
Gross Margin Impacts
The improvement in Gross Margin over five years at Dropbox highlights the company’s strategy to improve this margin as it neared its IPO. According to the company’s S-1 filing, the first reported gross margin was 33% in 2015. Since this time, Dropbox consistently grew gross margin and reported a 79% gross margin in fiscal year 2021.
Free Offering
Dropbox’s Gross Margin trend illustrates the impact of the free offering. Since the hosting and infrastructure costs associated with serving non-paying users is recorded as a direct expense in Cost of Revenue, the larger the ratio of non-paying to paying users, the greater the negative impact on Gross Margin. In 2017, the company reported 500 million total registered users of which only 2.2% or 11 million were paying customers. So, the free offering by the company dramatically depressed Gross Margin.
Capital Investments in Data Centers & Duplicate Data Sets
Dropbox certainly benefited from scale with paying users growing at a 17% CAGR during the five-year period starting in 2015; paying user count grew from 6.5 million to 14.3 million during this time. However, Dropbox made two decisive changes that proved to be the main drivers of this improvement in total customers. First, the company invested heavily to build high performance data centers and consolidated operations into the new facilities. In 2015 and 2016, the company invested over $200 million in capital expenditures for data centers as well as offices and patent purchases. This sum amounts to 14% of revenue for each of those two years. Compare this investment rate to the $24 million capital investment made in 2017; this is only 2% of revenue. Gross Margin also suffered in this earlier period because user data had to be duplicated before being relocated to servers in new facilities. During these two years, the company had to store double the amount of customer data, another reason for the abnormally low Gross Margin during this period. By 2017, Gross Margin grew to 68% on the strength of the new data center facilities as well as the elimination of duplicate data sets.
Policy Decisions
Dropbox’s Gross Margin improvement also resulted from operational decisions. Beginning in 2016, the company started closing accounts of long inactive users and implemented a policy to close accounts with no activity over the prior twelve months. Inquiries from these users were ignored thereby freeing up customer support time.
Sales and Marketing Expense
While it’s impossible to assign improvement percentages to each of the strategies employed by Dropbox after 2015, one can clearly see that Gross Margin grew to respectable levels as 78% is the median Subscription Gross Margin among the broader comparable set of all B2C SaaS companies.
 Dropbox’s Operating margins also illustrate how a high Cost of Revenue impacts a SaaS company’s financial profile. Dropbox Research & Development and General & Administrative cost categories averaged 27% and 17% of revenue respectively for the fiscal year 2015 during which time revenue was just over $600 million. These margins are consistent with those of SaaS companies broadly, especially those at comparable revenue levels when companies have achieved scale. Looking at two prominent B2C SaaS companies – Box and HubSpot – as specific comparable companies for the years with equivalent revenue levels, we can see that cost categories were consistent, with R&D at 23% and 27% and G&A at 15% and 14%. But Sales & Marketing expense was only 29% at Dropbox vs 51% and 50% for Box and HubSpot. This begs the question: how did Dropbox grow at a 22% CAGR over the past five years with such low S&M expense? The answer is that the cost of the free offering, which is the cost of the GTM strategy, is accounted for in COR and not in S&M. We can normalize Dropbox’s S&M expense margin by assuming a 75% gross margin and moving the remainder of the expense into the S&M cost category. Under this assumption, the S&M expense margin is 89%. This margin is high compared to the comparable metric at Box and Hubspot but is still consistent with high growth SaaS companies. And note that this was registered in the year before the company made the operational changes described above which positively impacted gross margin.
The point of this discussion is to reinforce the need for SaaS company teams to understand the mechanics and metrics of comparable B2C SaaS companies when using this type of analysis for decision-making. Dropbox’s strong performance allowed it to achieve significant scale and to grow gross margin to 79% in fiscal year 2021. Note that the company did this while reducing S&M expense margin to 20%. This result represents strong business performance as can be seen in the Rule of Forty metric. Dropbox achieved a combined 54% Rule of Forty metric (10% growth and 44% Free Cash Flow) in fiscal year 2021.
Cash Flow
Dropbox performs well on a cash flow basis due to the focus on upfront payments. In this way, the company avoids the Working Capital Trough problem we discussed earlier. Dropbox pricing offers a 17% to 20% discount as an incentive for annual payments. Also, the pricing default is shown as annual payments; subscribers would have to switch to monthly payments for this cadence. The net result is that Dropbox generates positive working capital each period.
We typically use Free Cash Flow (FCF) as a percentage of revenue for comparable analyses. But, to illustrate the impact of upfront payments we will use changes in working capital as a percentage of revenue. The change in working capital is defined as the period-to-period change in the net of current assets and current liabilities. For the fiscal years, 2017 to 2019, Dropbox generated positive working capital of between $80,000 and $90,000 and this averages approximately 6% of revenue. By way of comparison, Box and HubSpot generated working capital at averages of 1% and 3% respectively for the same three years. So, Dropbox outperforms these peers in collecting upfront payments.
Cohort Reporting
Cohort reporting is one of the most important tools for SaaS companies. Dropbox was one of the first to highlight cohort performance.
 Let’s return to Dropbox’s S-1 filing which includes two charts showing data that all SaaS companies need to prepare as part of their reporting cadence. The first shows the monthly subscription amount for all quarterly cohorts over a five-year period. The second provides a more detailed view of dollar-based expansion, shown indexed to the initial ARPU, for three quarterly cohorts. The main takeaways here are the company’s consistent onboarding of new subscribers and the dollar value expansion of the individual cohorts. Dropbox performs extremely well across both performance metrics, and this makes the charts compelling.
Internally, cohort reporting provides valuable insights into customer behavior. Cohorts should always be defined by months and may be segmented further by product used or by customer size. By tracking end user monthly subscription value over time, a CFO can identify the actions that lead to expansions. Product teams can use this information to then positively drive user expansion. Marketing teams can identify the end user marketing activities that drive higher ARPU. Monthly onboarding will demonstrate the efficacy of funnel conversion, allowing fine tuning of customer acquisition efforts. Marketing teams should run separate campaigns in the same period to observe conversion rates. Tracking the sets of subscribers that respond to each campaign over time can reveal the long term effectiveness of these campaigns. Segmenting customer cohorts by marketing campaign, the CFO can provide insights beyond the view provided by marketing systems. By observing churned customers, they can identify potential triggers and then act to help subscribers at that moment. For the ongoing reporting purposes, monthly cohort tracking by a CFO enables precise customer lifetime calculations and improved CLTV/CAC reporting.
The lesson on cohorts is that the CFO needs to provide detailed cohort reporting segmented in a way that best helps product and marketing teams understand how to improve the customer journey. The CFO then needs to summarize this detail into high level reporting that helps the management team, board of directors and investors understand business performance.
The Dropbox Example: Key Takeaways
At the highest level, this section provides an example of a B2C SaaS company, showing the financial profile and SaaS metrics. The more important takeaway is the value to your company of a detailed understanding of comparable companies. You can compare the data and produce reports consistent with industry expectations. And an in-depth understanding of related companies adds credibility to the CFO’s presentation on business performance. In short, such an analysis provides you with an answer to the common question: What should the number be?
Summary
The B2C Customer-Centric SaaS model is differentiated from other customer-centric models based on a different financial profile, go-to-market approaches and performance metrics. Applying the appropriate customer-centric framework and using the appropriate competitor comparables for your company will help you choose the best performance metrics for managing your B2C business.

Other SaaS articles by Eric Mersch:
- The Unique Challenges of Enterprise SaaS
- Driving Success for Small to Middle-Market SaaS Companies
- SaaS Glossary: Metrics, Benchmarks and Ratios Used in SaaS Business Performance Review

Eric Mersch
Eric Mersch has over 25 years of executive finance experience including twice serving in public company Chief Financial Officer roles. Eric is an equity partner at FLG Partners where he works as an Interim CFO to venture and private equity portfolio companies, specializing in Strategy and Operations, Strategic Planning, Equity…Read More